Unlock Career Growth as a Pricing Analyst with these Advanced Excel Skills
Published On 13 November, 2024
As a Pricing Analyst, you’re at the heart of one of the most critical functions in any company—driving profitability through effective pricing strategies. But to do that well, you need more than just good instincts. You need tools that help you navigate large datasets, build innovative pricing models, and communicate insights that matter. And when it comes to tools, Excel is a powerful friend you’ll want in your corner.
We’re not just talking about basic spreadsheet skills here. To excel in your role, mastering Excel’s advanced features can make a massive difference. Whether dealing with complex pricing models or analysing market trends, learning these 15 Excel techniques will boost your productivity, sharpen your decision-making, and take your career to the next level.

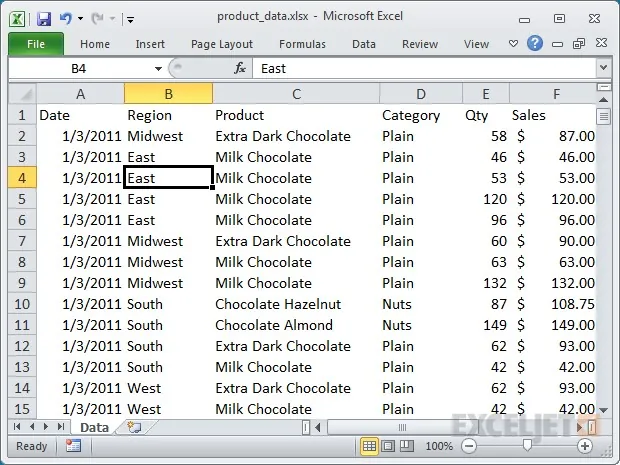
1. Pivot Tables: Quickly Summarise Data to See the Big Picture
Why it matters: Pivot Tables are a lifesaver when dealing with mountains of data. Instead of drowning in numbers, they allow you to quickly make sense of it, helping you find trends and insights quickly.
When to use it: Pivot tables are your go-to whenever you need to analyse sales data, break down customer segments, or compare performance across different regions. They’re perfect for turning overwhelming datasets into meaningful summaries.
How to use it: Highlight your data, go to Insert, then click PivotTable. To summarise your data, drag and drop fields like Product, Region, or Sales into Rows, Columns, and Values.
Why it’s a game-changer: With Pivot Tables, you can turn complex data into simple, digestible insights. In minutes, you’ll know where your pricing strategy is working and where it’s not. It’s like seeing the forest instead of getting lost in the trees.
2. VLOOKUP, HLOOKUP, and XLOOKUP: Find Data Without Breaking a Sweat
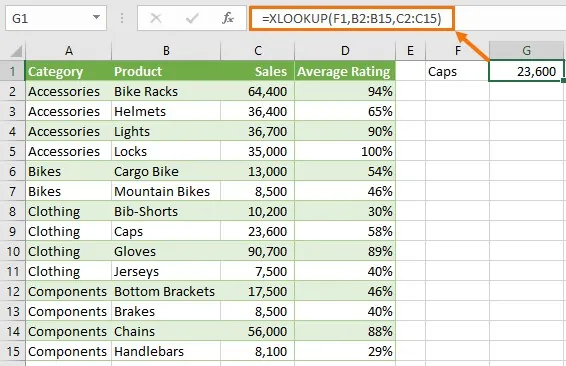
Why it matters: When working with large spreadsheets, finding the right piece of data can feel like looking for a needle in a haystack. That’s where these lookup functions come in—they help you find what you need without endless scrolling.
When to use it: Do you need to match product prices with product IDs or retrieve sales figures from a different sheet? These functions are ideal for quickly finding the necessary information across multiple tables.
How to use it: VLOOKUP and HLOOKUP are useful for more straightforward vertical or horizontal searches, but XLOOKUP is the most powerful, allowing you to search in both directions. It doesn’t require the lookup column to be the first in the table!
Why it’s a game-changer: Instead of wasting time manually searching through rows and columns, these functions do the work for you—quickly and accurately. You’ll find yourself zipping through complex data and getting answers in seconds.
3. IF Statements: Make Your Models Smarter
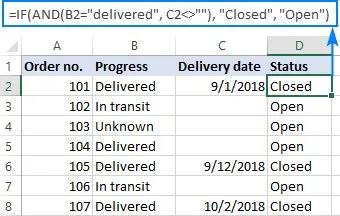
Why it matters: Sometimes, your pricing model needs to adapt on the fly, such as when applying discounts for bulk orders or flagging certain products for review. IF statements allow you to introduce logic and conditions, making your models more dynamic.
When to use it: You need your model to act based on specific criteria. For example, you can automatically apply a discount if a customer’s order exceeds £1,000.
How to use it: The formula is simple: =IF(Condition, ValueIfTrue, ValueIfFalse). For example, to offer a 10% discount for orders over £1,000, you’d use =IF(OrderAmount > 1000, Price * 0.9, Price).
Why it’s a game-changer: IF statements allow your models to think independently, whether creating tiered pricing structures or automating repetitive decisions. They also make your life easier by building logic into your pricing strategy.
4. Data Validation: Prevent Errors Before They Happen
Why it matters: One wrong entry can throw off an entire pricing analysis. Data Validation ensures that only the correct data is entered into your pricing models, saving you headaches later.
When to use it: Use Data Validation to limit what users can enter, such as limiting input to a range (e.g., prices between £100 and £500) or creating dropdowns for regions or product categories.
How to use it: Go to the Data tab, click Data Validation, and set your parameters, such as whole numbers or list values. You can even add a message to guide users when entering invalid data.
Why it’s a game-changer: It eliminates guesswork and errors, helping you keep your data clean and your analysis accurate. Think of it as putting guardrails on your spreadsheet—keeping everything in line so you can focus on making intelligent pricing decisions.

5. Goal Seek: Hit Your Targets, Every Time
Why it matters: Whether you’re trying to hit a specific revenue target or profit margin, Goal Seek can help you figure out what needs to happen to get there. It lets you reverse-engineer your way to success.
When to use it: If you know the desired result (like reaching $100,000 in revenue) but aren’t sure what price per unit will get you there, Goal Seek will calculate for you.
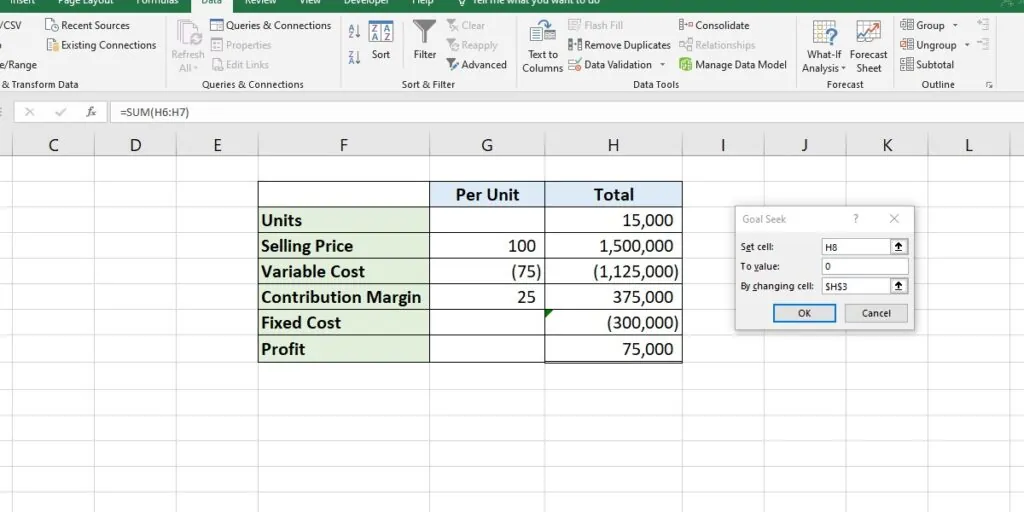
How to use it: Go to What-If Analysis under the Data tab, click Goal Seek, enter the result you want to achieve, such as your target revenue, and let Excel adjust the price until it finds the answer.
Why it’s a game-changer: You no longer need to play guessing games. Goal Seek takes the guesswork out of pricing and tells you exactly what needs to happen to achieve your financial goals.
6. Solver: Find the Optimal Pricing Strategy
Why it matters: Solver is like Goal Seek on steroids. It doesn’t just help you hit a target—it enables you to find the best solution when multiple variables and constraints are involved. This is especially useful when you have limitations like production capacity or budget restrictions.
When to use it: Solver is perfect for more complex pricing problems where you need to optimise for profit, but there are real-world constraints, like keeping production under 10,000 units or ensuring prices don’t drop below a certain level.
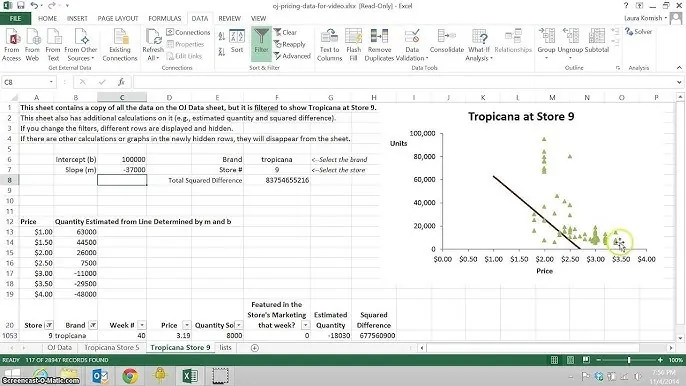
How to use it: Go to the Data tab and click Solver. Set your objective (e.g., maximise profit) and specify the variables you want to change (e.g., price or quantity). Then, add constraints like production capacity or price limits.
Why it’s a game-changer: Solver helps you find the sweet spot in your pricing strategy—balancing profitability with real-world constraints. It’s your go-to tool when simple “trial and error” just won’t cut it.
7. Conditional Formatting: Let Your Data Speak for Itself
Why it matters: You need to focus on what matters most, and sometimes, raw numbers just don’t tell the story. Conditional Formatting helps you visualise key trends, such as identifying top-performing products or quickly flagging problem areas.
When to use it: Highlight high-margin products, flag low-performing regions, or bring attention to products that need price adjustments.
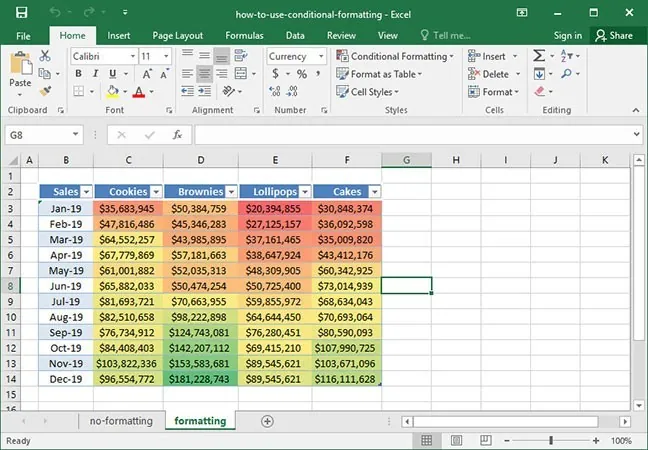
How to use it: Select your data, go to Conditional Formatting under the Home tab, and apply rules based on your criteria. For instance, you can highlight all products with margins over 50% in green or flag sales declines in red.
Why it’s a game-changer: This feature makes your data jump off the page, helping you and your team spot important insights at a glance. It also saves you from sifting through rows of numbers to find what matters.
8. Scenario Analysis: Test Your Pricing Strategies
Why it matters: Pricing is about making decisions in an uncertain world. Scenario Analysis lets you test different pricing strategies and see how they will perform under varying market conditions, so you’re prepared for anything.
When to use it: Use Scenario Analysis to compare different pricing strategies, such as testing the impact of price increases, discounts, or product launches under various market conditions.
How to use it: Build your model, then go to What-If Analysis and select Scenario Manager. You can create different scenarios and quickly compare the outcomes, helping you choose the best course of action.
Why it’s a game-changer: Scenario Analysis gives you the power to look into the future and prepare for multiple outcomes. It takes the guesswork out of pricing and helps you make informed, data-backed decisions.
9. INDEX-MATCH: A More Powerful Data Lookup
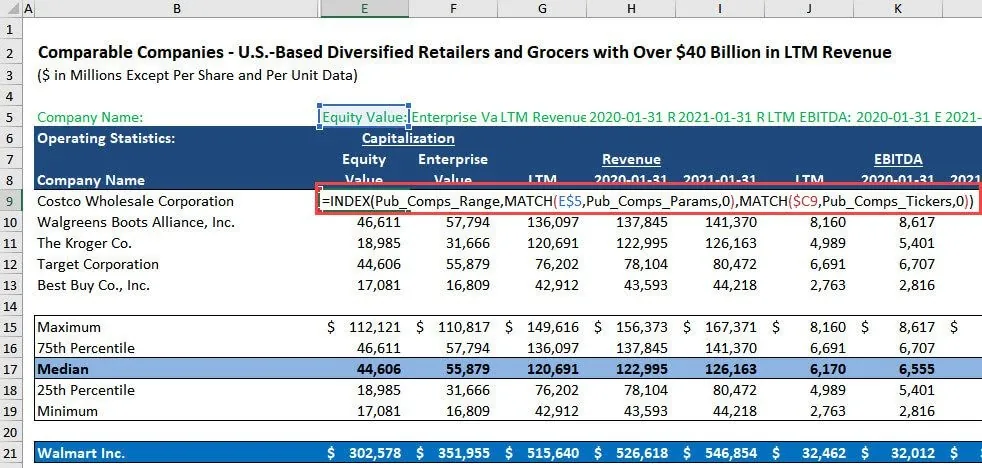
Why it matters: INDEX-MATCH is a powerful alternative to VLOOKUP. It allows you to search data in any direction and across multiple criteria, making it a must-have tool for handling complex datasets.
When to use it: Use INDEX-MATCH when you need to look up values in a dataset where the data isn’t arranged neatly. For example, when looking for prices based on both product and region.
How to use it: Use the formula =INDEX(ReturnRange, MATCH(LookupValue, LookupRange, 0)) to find the needed data. Unlike VLOOKUP, it doesn’t require the lookup column to be in the first position.
Why it’s a game-changer: It’s flexible and handles more complex data retrieval tasks than VLOOKUP, making it perfect for advanced pricing analysis.
10. Charts and Graphs: Communicate Insights Visually
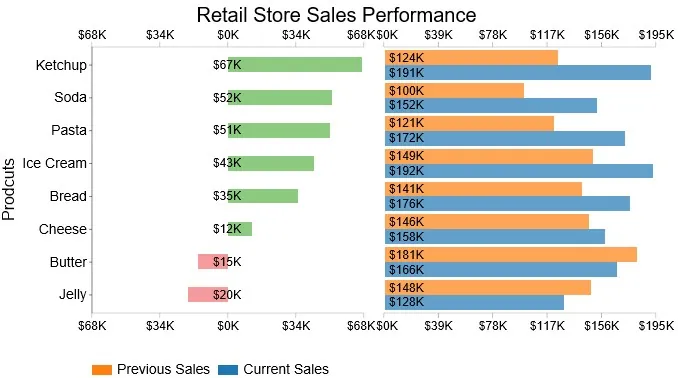
Why it matters: A good Pricing Analyst doesn’t just crunch numbers—they communicate insights clearly to others. Charts and graphs are essential for turning data into stories your stakeholders can understand.
When to use it: Charts make your findings easier to digest, whether you’re showing sales trends, price fluctuations, or regional performance.
How to use it: Select your data, then go to the Insert tab and choose a chart type—line, bar, pie—depending on what best represents your data.
Why it’s a game-changer: People respond to visuals. Charts and graphs make your insights more accessible and help others see the value of your pricing strategies.
11. Margin and Markup Calculations: Ensure Profitability
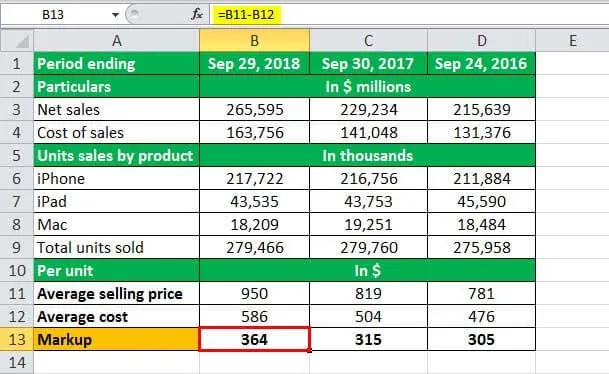
Why it matters: Ensuring that your price covers costs and meets profitability goals is at the core of every pricing decision. Knowing how to calculate margin and markup is critical for confident pricing.
When to use it: Use margin and markup calculations to determine how much you need to charge to remain profitable and competitive.
How to use it:
- Margin formula: =((Price – Cost) / Price)
- Markup formula: =((Price – Cost) / Cost)
Why it’s a game-changer: With these formulas, you’ll never have to second-guess whether your prices are sustainable or leaving money on the table.
12. Pricing Waterfall Analysis: Spot Profit Leaks
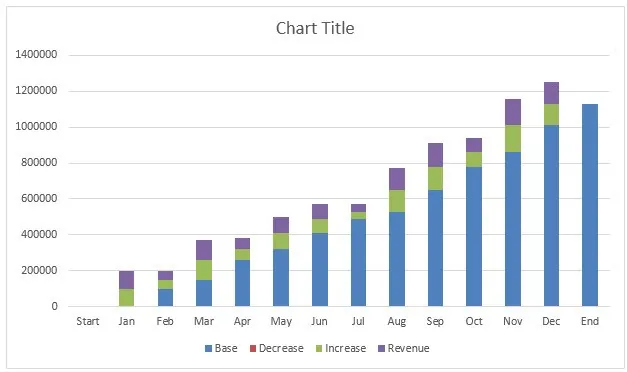
Why it matters: Pricing Waterfall Analysis helps you see how discounts, rebates, and other deductions affect your net realised price. This allows you to find and fix areas where profitability is leaking.
When to use it: Use it to track all the deductions between the list price and the net price, including promotions, discounts, and rebates.
How to use it: Start with the list price and apply each deduction step-by-step to see the actual realised price. You can visualise the process using Excel’s step chart feature.
Why it’s a game-changer: By identifying where profits are slipping through the cracks, you can make adjustments and optimise your pricing strategy for maximum profitability.
13. Sensitivity Analysis: Anticipate Pricing Risks
Why it matters: Sensitivity Analysis helps you predict how your pricing strategies will perform under changing market conditions, ensuring you’re prepared for potential risks.
When to use it: Use it when you want to assess how sensitive your profits are to changes in variables like price, cost, or demand.
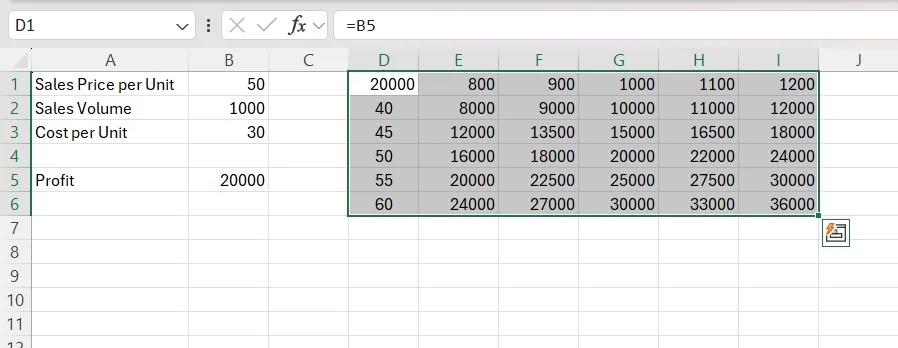
How to use it: Set up your pricing model, then use Excel’s Data Table feature to simulate different scenarios and observe how small changes impact profitability.
Why it’s a game-changer: It helps you understand your pricing strategy’s risks and tipping points, allowing you to adjust and stay ahead of potential issues.
14. Customer Lifetime Value (CLV): Focus on Long-Term Gains
Why it matters: Understanding how much value a customer brings over the long term is crucial for setting pricing that maximises profitability beyond immediate sales. CLV helps you price with a focus on the bigger picture.
When to use it: Use CLV to factor in a customer’s long-term value rather than just a single transaction. It’s particularly useful for subscription-based models or businesses with repeat customers.
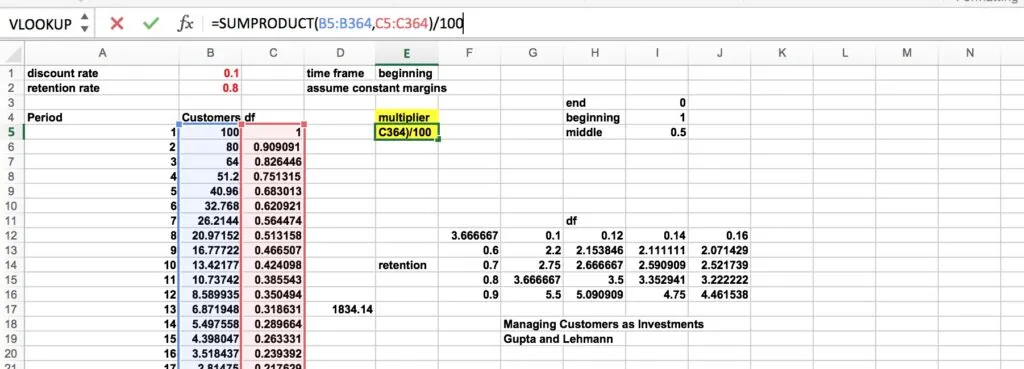
How to use it: Calculate CLV by multiplying the average purchase value, purchase frequency, and the expected lifespan of the customer relationship.
Why it’s a game-changer: CLV ensures that you price with long-term profitability in mind, not just short-term revenue. It’s a powerful tool for creating sustainable growth.
15. Tiered Pricing: Offer Flexibility and Maximise Revenue
Why it matters: Tiered pricing allows you to offer different pricing options based on product features or service levels, giving customers flexibility while increasing your revenue potential.
When to use it: Tiered pricing is useful when you want to cater to a broader audience. You can offer budget, standard, and premium options to capture different segments.
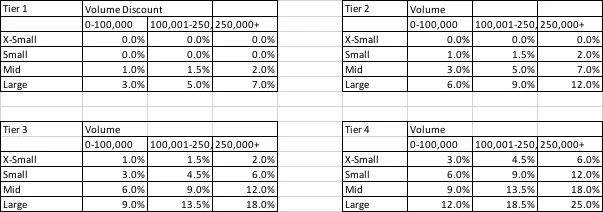
How to use it: Use Excel to build pricing models for each tier and simulate how each level performs across various customer groups. You can then compare the revenue generated by different tiers to optimise your pricing structure.
Why it’s a game-changer: Tiered pricing allows you to reach more customers without sacrificing profitability. It allows you to offer something for everyone, increasing your chances of capturing more market share.
Mastering these 15 Excel techniques will take you from good to great in your role as a Pricing Analyst. Not only will you be more efficient in managing data and building pricing models, but you’ll also be able to provide more valuable insights and drive better pricing strategies. Each technique will help you build a toolkit that makes you indispensable to your team—and your company. So, take the time to learn them well, and watch as your career prospects grow.
If you want to excel in your career, get qualified in pricing! Pricing University teaches you the fundamental pricing techniques to advance your career and get recognised and promoted for pricing excellence.


